|
|
Filter, sort and customize datasets
You can explore a dataset by filtering and sorting the content—even before you start coding any data. For example, you could filter the data to see only those comments by respondents in a particular age group.
This topic describes the ways you can manipulate the content for easy exploration.
Show or hide fields (columns)
By default, all fields in the dataset are shown. You may want to hide columns—for example, if you want to focus on particular content, or if you want to hide demographic information about survey respondents to avoid coding bias.
To hide columns:
-
Click
 at the bottom of the dataset
in Detail View.
 -
Clear the check boxes for the columns you want to hide.
To show hidden columns:
-
Click
 at the bottom of the dataset
in Detail View.
 -
Select the check boxes for the columns you want to show.
NOTE If you want to display all hidden columns, click Show All.
Adjust column width
To adjust the width of a single column:
-
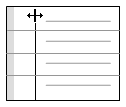
Drag the boundary on the right side of the column heading until the column is the width that you want.

Filter datasets
You can apply filters to the classifying columns (fields) in your dataset, to show or hide rows that match certain criteria. For example, you could apply a filter to the column Sex so that only rows containing comments by Females are displayed.
You can apply filters to more than one column. For example, in a dataset of survey responses, you can filter the Sex column to show only Females, and then apply a filter to the Age Range column so that you show only respondents aged between 20-29 years. With both filters applied, you will see only rows where the respondent was Female aged 20-29 years.
To filter the dataset:
-
Select the classifying column you want to filter.
-
On the Layout tab, in the Sort & Filter group, click Filter, and then click Filter Column.
Shortcut
Click the filter icon  at
the top of the column.

-
Specify the filter you want to apply to the column—refer to Applying filters or more information.
-
Click OK. The filter icon
 at the
top of the column displays red to indicate a filter has been applied.
NOTE
-
To clear the filter on a selected column—on the Layout tab, in the Sort & Filter group, click Filter, and then click Clear Filter on Column. You can also clear the filter by clicking the filter icon
 , and then
clicking the Clear Filter button
on the dialog.
 -
To clear all filters in the dataset—on the Layout tab, in the Sort & Filter group, click Filter, and then select Clear All Column Filters.
Sort datasets
To sort the dataset by the values in a single column:
-
Select the classifying column you want to sort by.
-
On the Layout tab, in the Sort & Filter group, click Sort By, and then click Column.
To sort the dataset by the values in two or more classifying columns:
-
On the Layout tab, in the Sort & Filter group, click Sort By, and then click Custom.

-
Define your sort criteria as follows:
-
Select the Dataset Columns you want to sort by—use the Right arrow
 to move them to the Sort
Columns list
 -
Use the Ascending
 and Descending
 buttons to change the direction of the sort for
a particular column
 -
Use the Up and Down buttons
 to reorder columns in the Sort Columns
list—the data is sorted on the first column, then sorted on the next
column in the list and so on.
-
Click OK.
NOTE To clear all sorting, and return the dataset to its original sequence—on the Layout tab, in the Sort & Filter group, click Sort By, and then click Clear All Sorts.


