


|
|

Run a Coding Comparison query
Compare coding done by two users (or user groups) to measure the 'inter-rater reliability' or degree of agreement for coding between the users. You need NVivo for Mac Version 11.1 or later to run a Coding Comparison query.
In this topic
- Understand Coding Comparison queries
- Create a Coding Comparison query
- View the agreement or disagreement in coding
- How is the percentage agreement calculated?
- How is the Kappa coefficient calculated?
- How should the value of Kappa be interpreted?
- Why can the value of Kappa be low when the percentage agreement is high?
- What does a negative Kappa coefficient mean?
- All my Kappa coefficients are 0 or 1. Is something wrong?
Understand Coding Comparison queries
A Coding Comparison query enables you to compare coding done by two users or two groups of users.
It provides ways of measuring 'inter-rater reliability' or the degree of agreement between the users: through the calculation of the percentage agreement and 'Kappa coefficient'.
-
Percentage agreement is the number of units of agreement divided by the total units of measure within the data item, displayed as a percentage.
-
Kappa coefficient is a statistical measure which takes into account the amount of agreement that could be expected to occur through chance.
When you run a Coding Comparison query the results are displayed in Detail View:
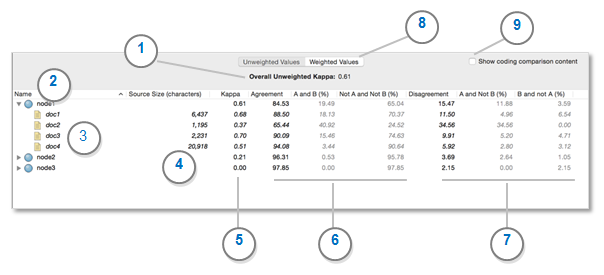
1 Overall Kappa coefficient for nodes and sources specified in the query. If the users are in complete agreement then the Kappa coefficient (K) = 1. If there is no agreement among the raters (other than what would be expected by chance) then the Kappa coefficient (K) ≤ 0.
2 The node that contains the coding that is being compared. You can expand the nodes to see the sources.
3 The source name.
4 The source size, which is based on number of characters, sentences, or paragraphs, depending on the query criteria.
5 The Kappa coefficient for each node or node/source combination.
6 These columns show percentage agreement:
-
Agreement Column = sum of columns A and B and Not A and Not B
-
A and B = the percentage of data item content coded to the selected node by both Project User Group A and Project User Group B
-
Not A and Not B = the percentage of data item content coded by neither Project User Group A and Project User Group B
7 These columns show percentage disagreement:
-
Disagreement Column = sums of columns A and Not B and B and Not A
-
A and Not B = the percentage of data item content coded by Project User Group A and not coded by Project User Group B
-
B and Not A = the percentage of data item content coded by Project User Group B and not coded by Project User Group A
8 You can display the results of a Coding Comparison query using either:
-
Unweighted Values Sources are treated equally (regardless of size) when calculating the overall results for each node.
-
Weighted Values Source size is taken into account when calculating the overall results for each node. Source Size is the characters, sentences or paragraphs, depending on the options chosen in the query criteria. For example, a document with 1000 paragraphs would contribute more to the overall results than a document with only 20 paragraphs.
9 Select the Show coding comparison content check box if you want to see where there is agreement or disagreement in coding for a particular source or node. (Version 11.1.1 or later).

Create a Coding Comparison query
-
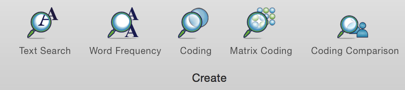
On the Query tab, in the Create group, click Coding Comparison.
-
Next to Search in, choose the sources that you want to compare.
NOTE Only text sources (documents, PDFs, memos, and externals) are supported in this release of NVivo for Mac. Other source types—for example, pictures or datasets—are not included.
-
Next to Coded At, choose the selected nodes that contain the coding you want to compare. Alternatively, you can choose all nodes, nodes in selected sets, or cases with selected classifications.
-
For User Group A and User Group B, click
 to select the users whose coding you want
to compare.
to select the users whose coding you want
to compare.
-
Select whether you want the calculations to be based on character, sentence or paragraph.
-
Click the Run Query button at the top of Detail View.
When the query has finished running, the results are displayed in Detail View.
NOTE
-
When selecting nodes in the query criteria, you can select all descendent nodes in a hierarchy by holding down the Option key when you select a node higher in the hierarchy. Refer to Selecting project Items for more information.
-
To save the query in the project, click the Save Query button at the top of Detail View. If you do not save the query, it will be discarded when you close the unsaved query or close your project.
-
To see where there is agreement or disagreement in coding between the two user groups for a specific source or node, select the Show coding comparison content check box. (Version 11.1.1 or later).
-
Although you cannot save the query results within NVivo, you can export the results of a Coding Comparison query and then import them to other applications such as Excel. Refer to Export query results for more information.
View the agreement or disagreement in coding
You can dig deeper to see the content that was coded the same or differently between users or user groups.
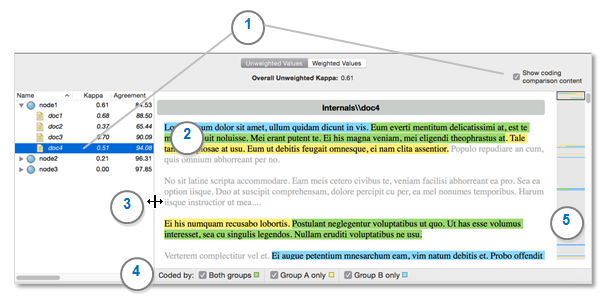
1 Select a source or node in the query results and then select the Show coding comparison content check box to display the content pane. Alternatively, you can double click on a source or node in the query results to display the coding comparison content pane.
With the coding comparison content pane visible, click on another source or node to change the content that is displayed. To return to the tabular display of the query results, deselect the Show coding comparison content check box
2 Colored shading indicates the areas of the source that were coded.
The color of the shading identifies where there was agreement or disagreement. Content that is shaded:
-
Green was coded by both groups. (Agreement)
-
Yellow was coded by Group A only. (Disagreement)
-
Blue was coded by Group B only. (Disagreement)
Passages that were not coded by either Group A or Group B are displayed as grey text and can help provide context when reviewing the results.
The shading may include more text than was actually coded—for example, if your query criteria calculations were based on sentence, then a partially coded sentence would be shaded in its entirety.
3 Adjust the width of the content pane—for example, make it bigger to fit more text in the pane or make it smaller to see more of the tabular query results.
4 Show or hide shading by selecting or deselecting the check boxes for a particular color. For example, if you want to focus your attention on the disagreement in coding, deselect the Both groups check box to hide the green shading.
5 You can quickly see where there is agreement or disagreement in the source or node using the green, yellow, and blue markers on the scroll bar. Click in the scroll bar (or drag) to navigate to a different area of the content—for example, click on a blue marker to move to a passage that was coded by Group B only.
NOTE You need NVivo for Mac Version 11.1.1 or later to display the coding comparison content pane.
How is the percentage agreement calculated?
NVivo calculates percentage agreement individually for each combination of node and source. Percentage agreement is the percentage of the source’s content where the two users agree on whether the content may be coded at the node.
The calculations can be based on character, sentence or paragraph. Calculations based on character yield the most precise results.
| Calculations based on | Example |
| Character |
If the source is a document with 1000 characters, where:
then the percentage agreement is calculated as (700 + 50) ÷ 1000 = 80%. |
| Sentence |
If the source is a document with 100 sentences, where:
then the percentage agreement is calculated as (80 + 5) ÷ 100 = 85%. |
| Paragraph |
If the source is a document with 10 paragraphs, where:
then the percentage agreement is calculated as (4 + 5) ÷ 10 = 90%. |
How is the Kappa coefficient calculated?
Cohen’s Kappa coefficient is a statistical measure of inter-rater reliability which many researchers regard as more useful than the percentage agreement figure, since it takes into account the amount of agreement that could be expected to occur through chance. For more information, refer to the Wikipedia article Cohen's kappa.
NVivo calculates the Kappa coefficient individually for each combination of node and source, as well as an overall Kappa coefficient.
If the two users are in complete agreement about which content of the source should be coded at the node, then the Kappa coefficient is 1. If there is no agreement between the two users (other than what could be expected by chance), the Kappa coefficient is ≤ 0. A value between 0 and 1 indicates partial agreement.
The Kappa coefficient is calculated as follows. (Note that the units of measure are character, sentence, or paragraph, depending on the selection made in the query criteria).
-
Calculate the expected frequency by which the agreement between users could have occurred by chance (ΣEF), by summing:
-
The number of units of the source’s content coded at the node by user A, multiplied by the number of units coded at the node by user B, divided by the total number of units in the source (EF1)
-
The number of units of the source’s content not coded at the node by user A, multiplied by the number of units not coded at the node by user B, divided by the total number of units in the source (EF2)
-
Expected frequency (EF) of the agreement occurring by chance = EF1 + EF2
-
Calculate the Kappa coefficient (K) as equal to:
-
Total units of agreement between the two users (TA) minus the expected frequency (ΣEF) of the agreement occurring by chance, divided by the total units (TU) within the source minus the expected frequency (ΣEF) of the agreement occurring by chance: K = (TA – ΣEF) ÷ (TU – ΣEF)
-
In the case where both users are in complete agreement as to how the source’s content should be coded at the node, then the value of Kappa will equal 1
For an example of how NVivo calculates Kappa coefficients, you can download the Coding Comparison Calculation Examples spreadsheet.
How should the value of Kappa be interpreted?
One approximate set of guidelines for interpreting the value of Kappa is:
| Kappa value | Interpretation |
| Below 0.40 | Poor agreement |
| 0.40 – 0.75 | Fair to good agreement |
| Over 0.75 | Excellent agreement |
Why can the value of Kappa be low when the percentage agreement is high?
Because the Kappa coefficient calculation takes into account the likelihood of the agreement between users occurring by chance, the value of Kappa can be low even though the percentage agreement is high.
For example, if most of a source has not been coded at the node by either user, but each user has coded completely different small sections of the source at the node, then the percentage agreement between the users will be high. But since this situation would be highly likely to occur by chance (i.e. if the two users had each coded a small section at random), the Kappa coefficient is low.
Conversely, if most of a source has not been coded at the node by either user, but each user has coded almost the same sections of the source at the node, then the percentage agreement between the users will again be high. But this situation would be highly unlikely to occur by chance, so the Kappa coefficient is also high.
These examples indicate why many researchers regard the Kappa coefficient as a more useful measure of inter-rater reliability than the percentage agreement figure.
What does a negative Kappa coefficient mean?
A Kappa coefficient less than or equal to zero indicates that there is no agreement between the two users (other than what could be expected by chance) on which content in the source may be coded at the node.
All my Kappa coefficients are 0 or 1. Is something wrong?
This most often indicates that one of the two users being compared has not coded any of the selected sources at the selected nodes.
In your Coding Comparison query results:
-
If the columns “A and B (%)” and “A and Not B (%)” are both entirely full of zeros, then user A has not coded any of the sources at the selected nodes
-
If the columns “A and B (%)” and “B and Not A (%)” are both entirely full of zeros, then user B has not coded any of the sources at the selected nodes