|
|

Organize your demographic data
If your research involves interacting with people to gather their ideas or opinions, you will probably want to keep track of their demographic attributes (like age or gender) and use them as a basis for comparison. This topic explains how to setup demographic data depending on the type of source material you are working with.
In this topic
- Watch a video tutorial
- Manage demographic data using case classifications
- Setup demographic data for interview participants
- Setup demographic data for survey respondents
- Use demographic data in queries
Watch a video tutorial
Manage demographic data using case classifications
You use NVivo's case classifications to record descriptive information about the people or participants in your project. Although this topic focuses on people, you could also use case classifications to record descriptive information about institutions and places.
NVivo provides quick ways to organize your demographic data and the steps vary depending on the type of source material you are working with. In general, you need to:
-
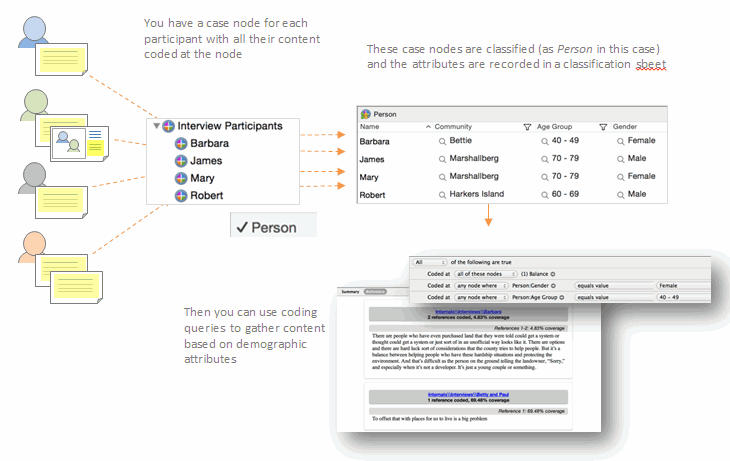
Make a case node for each participant.
-
Classify the case node as a person—you could also have classifications for different types of people, like students or teachers.
-
Assign the attributes—for example, age and gender.
- Code a participant's comments at their case node—coding is how you assign demographic attributes to the source content.
After setting up case nodes and coding your data, your project may look something like this:
 Top of Page
Setup demographic data for interview participants
If you have a source document for each interview, you can:
-
Import the interviews into NVivo—make sure the document names reflect the names you use to identify the interview participants.
-
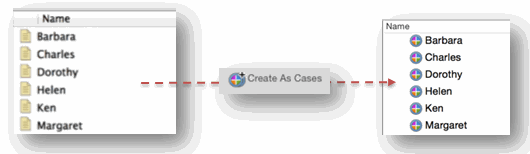
Create a case node for each participant and code their interview at the case node—to do this quickly, select all the interviews in list view, right-click and then select Create As > Create As Case Nodes and assign them to the person classification.
-
In Navigation view, click Classifications and then click Case Classifications. In List view, double-click the Person classification to open the classification sheet. You can then enter the values for each attribute. If you have this demographic data in a text file, you can import it—refer to Import classification sheets for more information.
If you are working with a focus group, you can manually create a case node for each participant, then code their content at the case node and set their attribute values in the classification sheet.
Setup demographic data for survey respondents
In a spreadsheet of survey results, demographic data (like age or gender) is usually contained in the rows or columns. To setup the demographic data in NVivo, you can:
-
Import the survey dataset into NVivo.
-
Use the Auto Code Assistant to create, classify and code at case nodes representing each of the respondents. Refer to Automatic coding in dataset sources for more information.
Use demographic data in queries
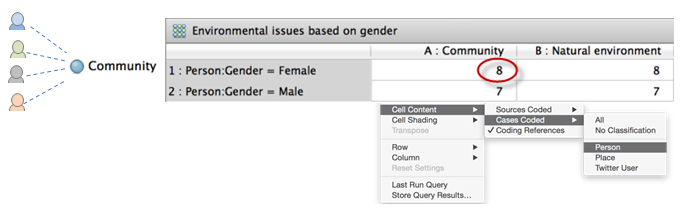
Once you setup the demographic data for your research participants, you can use queries to make comparisons. For example, you could use a matrix coding query to compare attitudes about environmental issues based on gender—this matrix displays the number of coding references at each intersection and helps you to answer questions like How often did women mention community? (you can double-click in the cell to see the coded content).
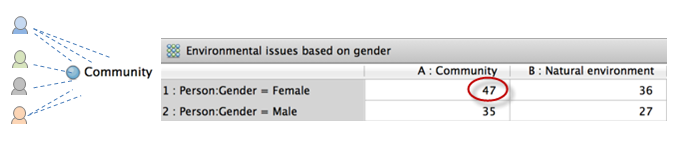
If you would rather ask the question How many women talked about community? you can change the count that is displayed in the matrix—right-click and select Cell Content, then click Cases Coded, and then click the classification Person.